Overview
Use Microsite Analytics to pull actionable insights so you can optimise your microsite and drive sales.
Get high level visibility of your customer’s execution points; clicks within site (how many clicked on order for delivery > selecting which outlets within delivery platform pages), see where customers are landing on the microsite and identify traffic source identification.
Such data points enables the you to track the customers’ journey and eventually enables retargeting, track drop out rates and more!
Video Guide
Microsite Cards

Momos provides you with a series of cards at the top of the page that is aimed to provide you with a quick overview of key stats. These cards are;
Visits
The number of visits on your microsite. A "visit" is counted when a user lands on your microsite.
There may be multiple visits from the same user if there is enough time that has passed since their last visit or activity on your microsite. (roughly 30 mins)
Clicks
The number of times visitors clicked on different buttons while browsing your microsite
Click Through Rate
The percentage of microsite visits where the visitor engaged on the site and had at least one click.
Average Visit Duration
The average duration of each visit on your microsite
Conversions out of Microsite
The number of times microsite visitors clicked through from your microsite to convert on other connected platforms or website.
Overall Engagement
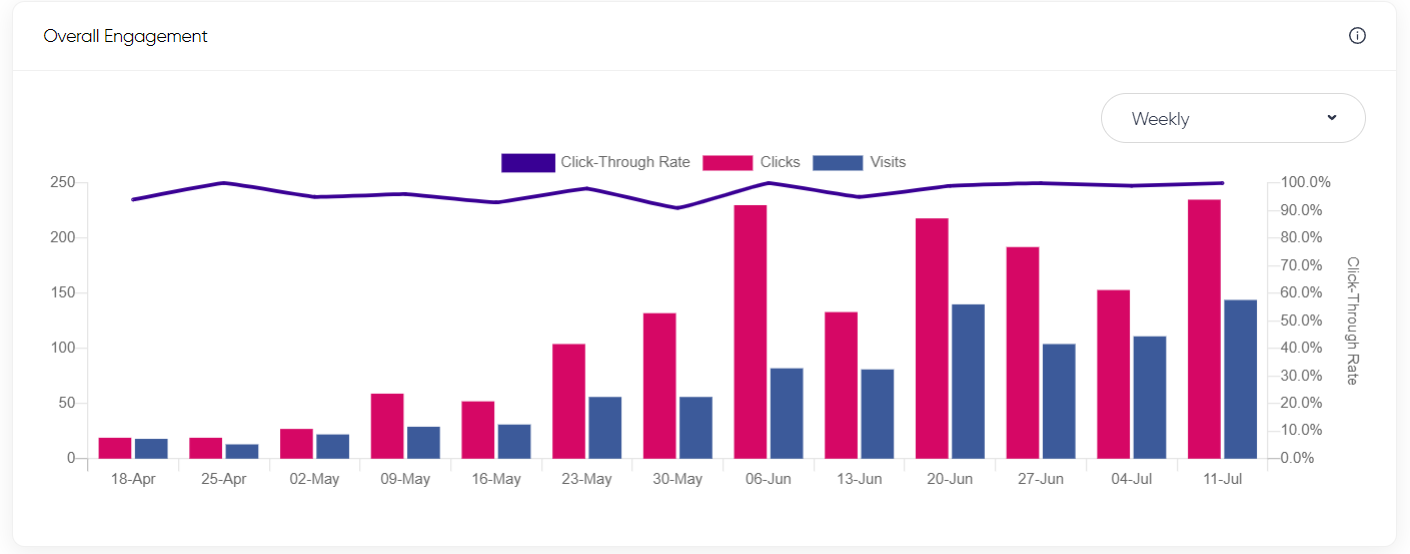
Below the cards is the "Overall Engagement" time-series graph.
This engagement time-series gives you an overview of the frequency of visits and activity on your microsite, for example; change in visits, page views, clicks, and click through rate over time.
Microsite visits & engagement by the city
In this table, you can see the top cities from where your microsite is getting the most visits, page views, and clicks from.
You can sort these stats to identify the cities that you need to focus on to increase the microsite visits and engagement.

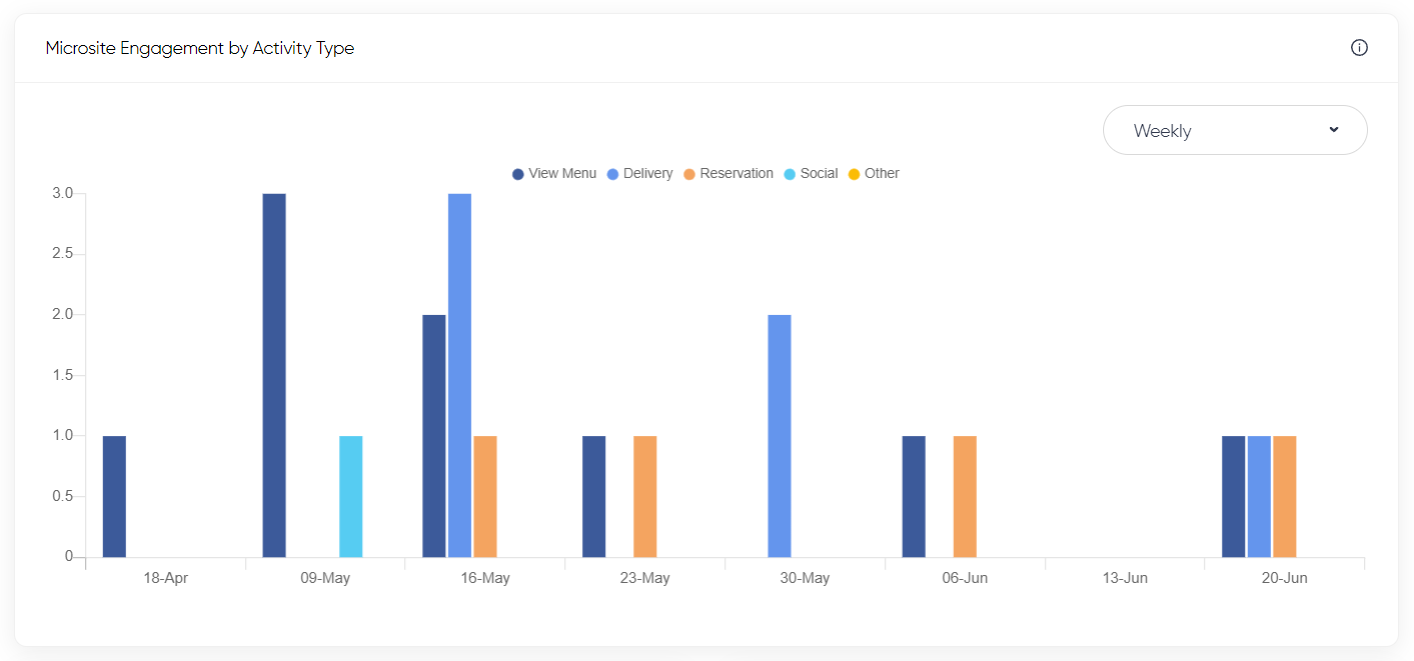
Microsite engagement by activity type
The time-series shows the change in the number of clicks for each type of activity on your microsite.
We categorize all of the clicks on your microsite in different activities to determine how many clicks are there for each activity.
Overall Microsite engagement by activity type
The chart breaks down the number of clicks for each type of activity on your microsite.
We categorize all of the clicks on your microsite in different activities to determine how many clicks are there for each activity.
Social Media Visits
The chart breaks down the number of times microsite visitors visited each of your social media channels through the microsite.
Go to Microsite Editor to add additional social media channels to your microsite to increase the number of visits on your social media channels.
Microsite visits breakdown by source
The chart breaks down your microsite visits by the source that the visitors are coming from.
Add your microsite URL on all of your marketing channels to direct traffic to your microsite and increase engagement.
Microsite assisted conversions breakdown
The chart breaks down the number of times microsite visitors clicked through from your microsite to convert on other connected platforms or website.
Go to Microsite Editor to connect your food delivery, dine-in reservation and other platforms to your microsite to increase conversions on these platforms.

Was this article helpful?
That’s Great!
Thank you for your feedback
Sorry! We couldn't be helpful
Thank you for your feedback
Feedback sent
We appreciate your effort and will try to fix the article